
Visualizing drone operations
New SkyZero capabilities

For the last few weeks, I’ve been lucky to work with Ian at Zing Drones on visualizing drone data. Zing does a lot of cool stuff, but the part I’ve been focused on is their drone detection hardware. They’ve been working with customers to outfit drones with small radios that can report not only the drone’s position, but also the positions of any drones nearby - it turns each equipped drone in to an operations management platform. Paired with Zing’s larger radio base station solution which can detect conforming and non-conforming drones, and you’ve got the start of really fine grained operations tracking. Our hope is that we can augment this with also any relevant low altitude aviation that might interfere through ADSB integration - super exciting.
Drone operators frequently need to visualize multiple aircraft as part of a single operation - showing a single flight of a single vehicle when there are 13 drones operating in the same space at the same time doesn’t make sense.
So, we built the drone operations visualizer.
Tracks results from multiple base stations at once
Plays back an animation of all drones flight paths and locations
Displays weather
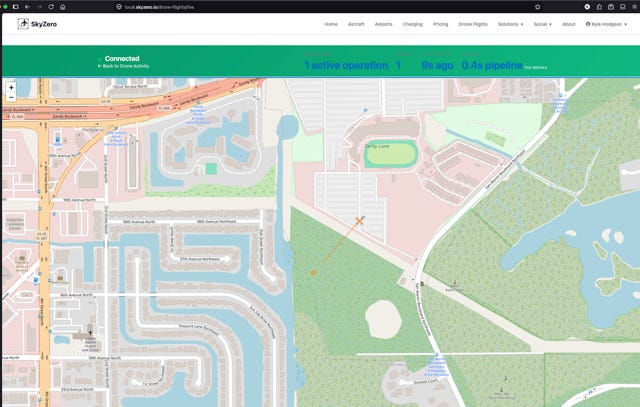
We’ve also built a real time visualizer. Today, we normally aggregate and process data every two hours - given that we’re analyzing the activity of a few OEMs working on certification, doing market tours, and flight schools training a handful of pilots, this has worked out.
However, if you’re trying to get a sense of your operations in real time, it’s not good enough.
We’ve designed our real time view for the lowest possible latency. We’ve observed times as low as 50ms (one twentieth of a second) from receipt of the drone’s location to updating the display, and we’re aiming for even faster. How do we do this?
Thanks to Zing’s superfast IoT platform, they can send us data every second - as soon as the data arrives in SkyZero’s AWS cloud queue the data is immediately sent to a queue that the web server can read from; the web server makes use of web sockets to push that data to authorized browsers immediately. We can also process that data as soon as it arrives; looking for potential collisions, for instance.
While we think the historical session visualizations will be helpful for operators so that they can play back what happened after the fact, the real time view combined with aviation data gives new capabilities that they don’t have today.